
Solar Facility Permitting & Visual Impact Study
Anaheim, CA
Client
Confidential
Services
Viewshed Analysis
Technical Studies
Great Ecology led site research on the potential land use and environmental impacts of a proposed 30-acre solar facility development in Anaheim, CA in support of an Initial Study for California Environmental Quality Act (CEQA). To inform site design, permitting plans, and improve community outreach efforts, Great Ecology conducted a visual impact study to determine the level of viewshed impact from the solar array. Utilizing GIS analysis and 3D modeling software, we created scale accurate renderings to determine ideal locations for plant installations to reduce viewshed impacts and serve as outreach materials to inform the surrounding communities.
The Visual Impact Analysis
One of the potential project obstacles this site developer faced is the “not in my backyard” or NIMBY opposition, whereby residents can oppose a project for fear of its visual impact on their scenic views. To convey the potential visual impact of this solar development, Great Ecology conducted a visual impact analysis to identify surrounding areas which have a line of sight to the project area and generated renderings showing the future views of those sites after solar installation. This analysis was submitted with the permit package and will be circulated to regional stakeholders to communicate the visual impact of the planned solar development.
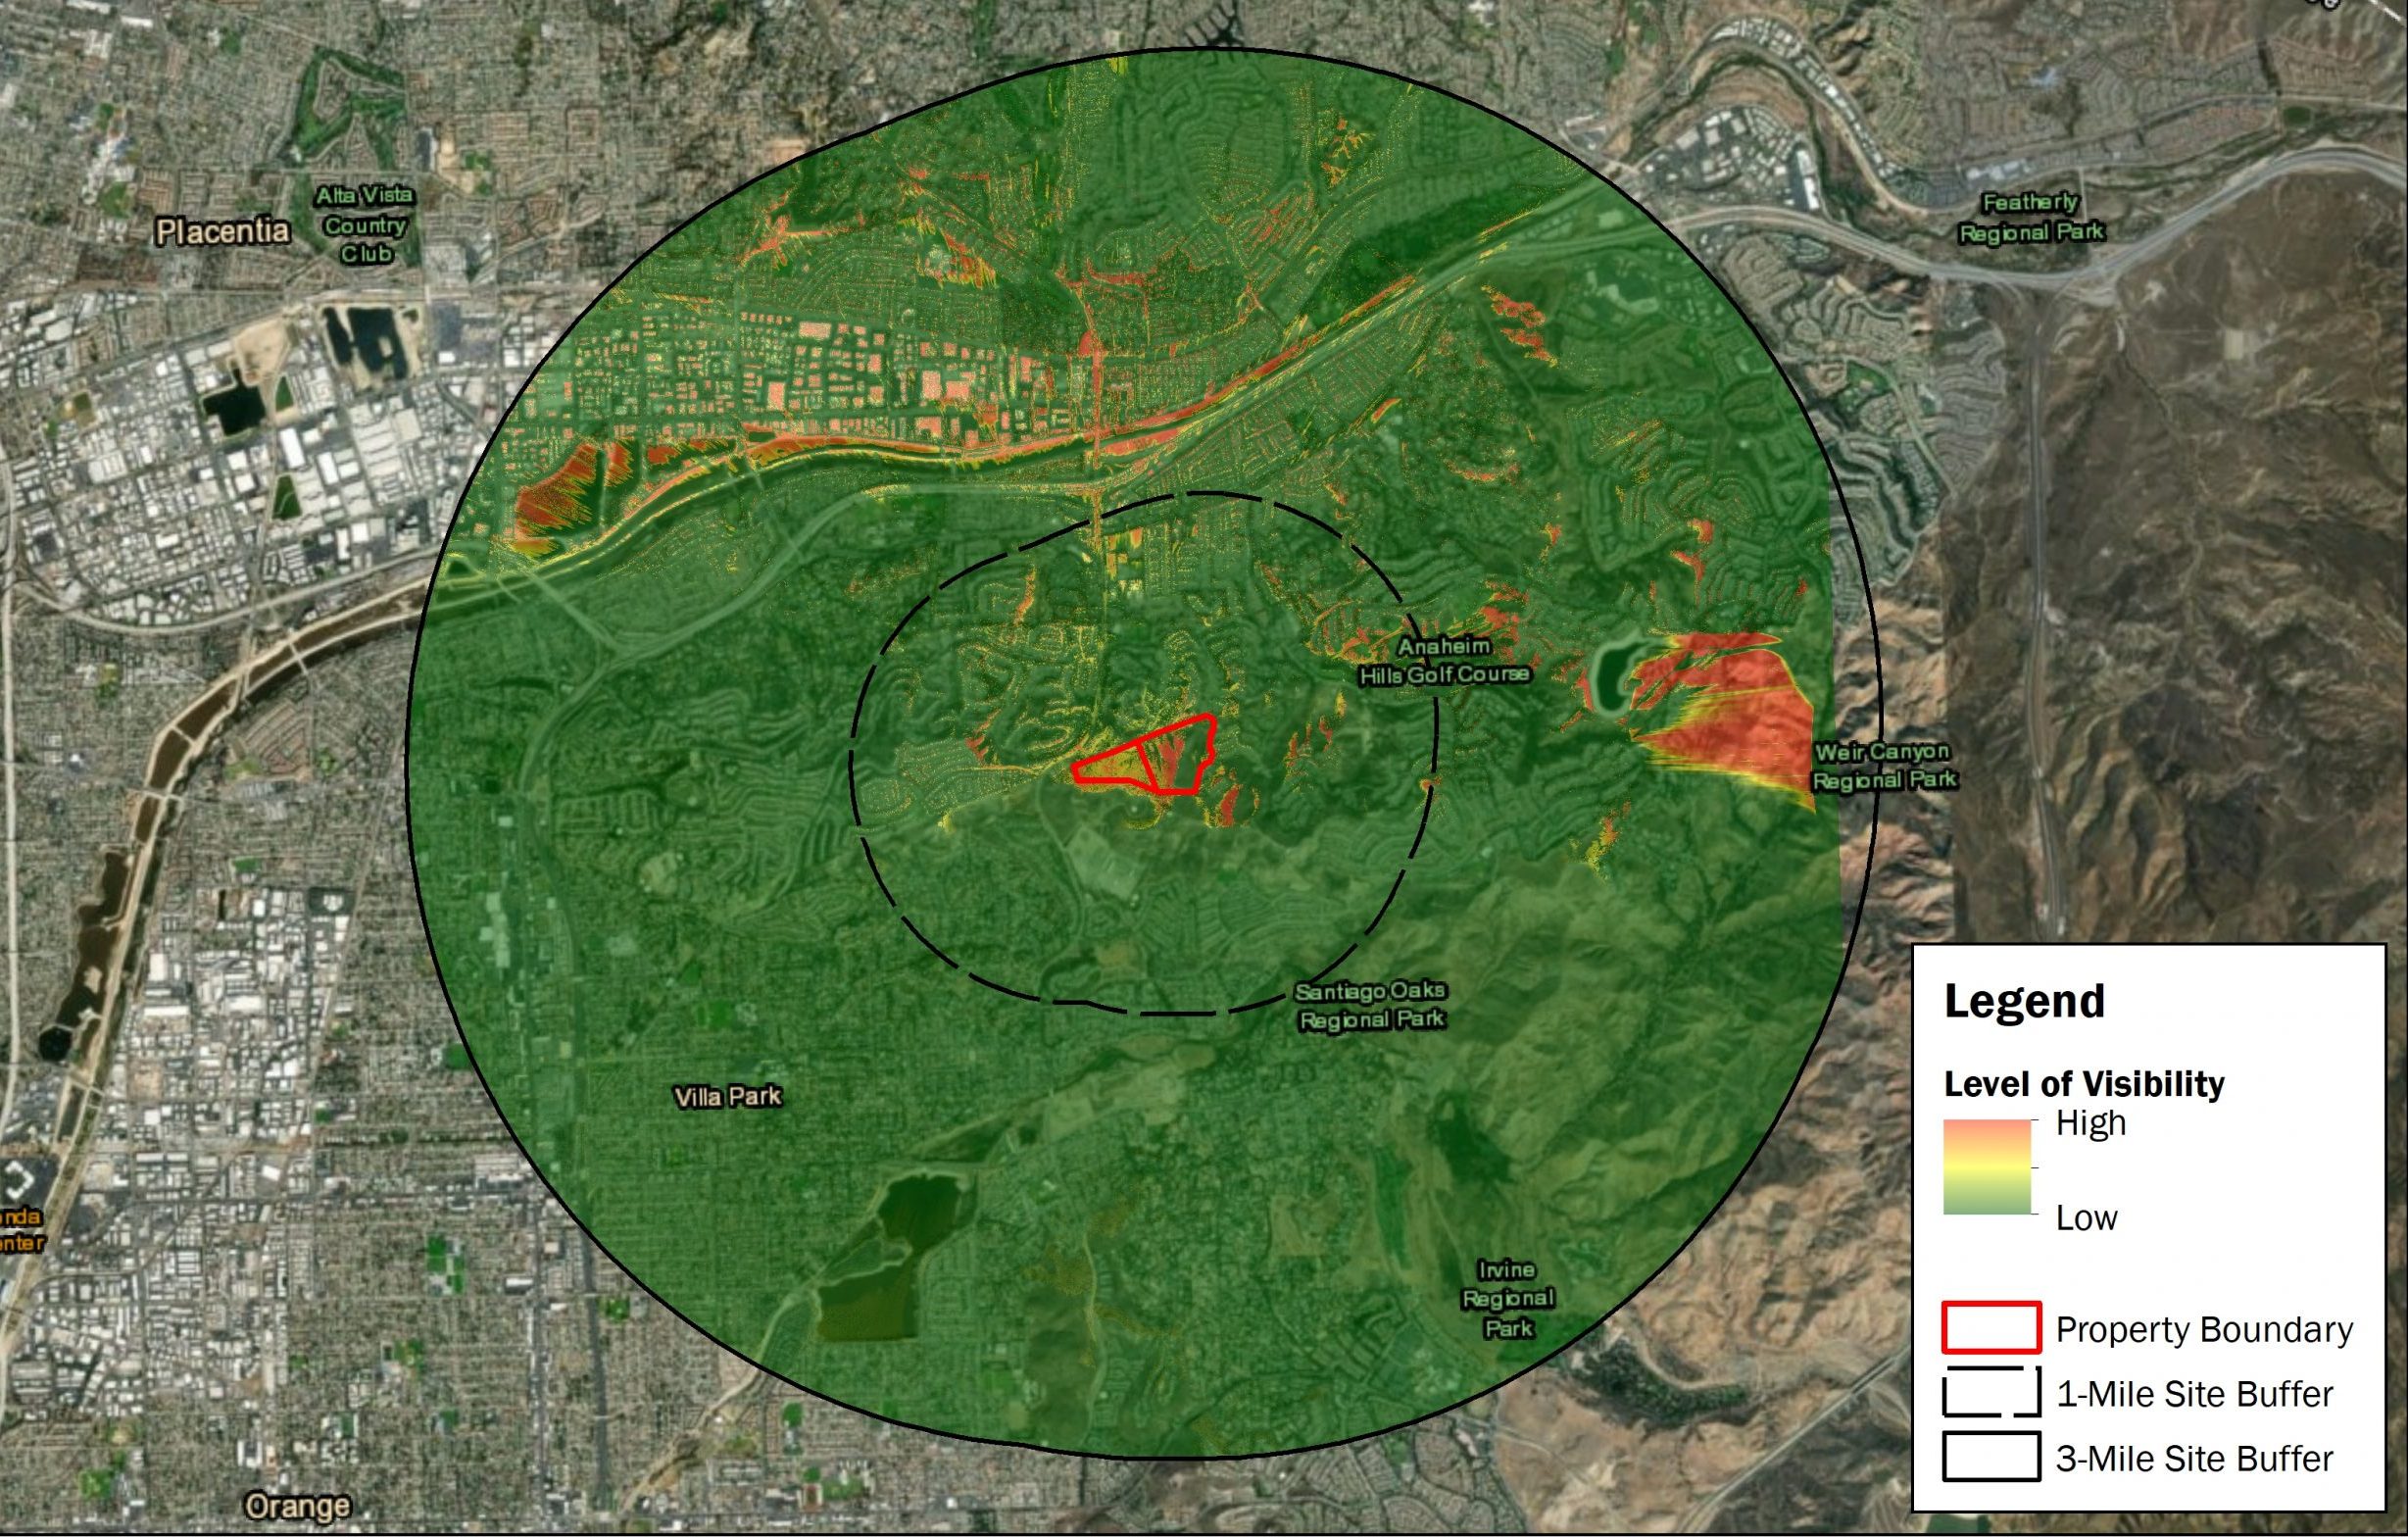
Step 1: Creation of a GIS Heatmap:
This heatmap shows the level of viewshed impact for communities within a 1 mile and 3 mile radius around the proposed development site. Not only does this heatmap indicate a significantly low viewshed impact on the local community, but it informed Great Ecology's field staff on the best locations to capture photos for use in site renderings. Utilizing photos from the communities most impacted (in red) and least impacted (in green) properly demonstrates the site's true impact on the local viewshed.
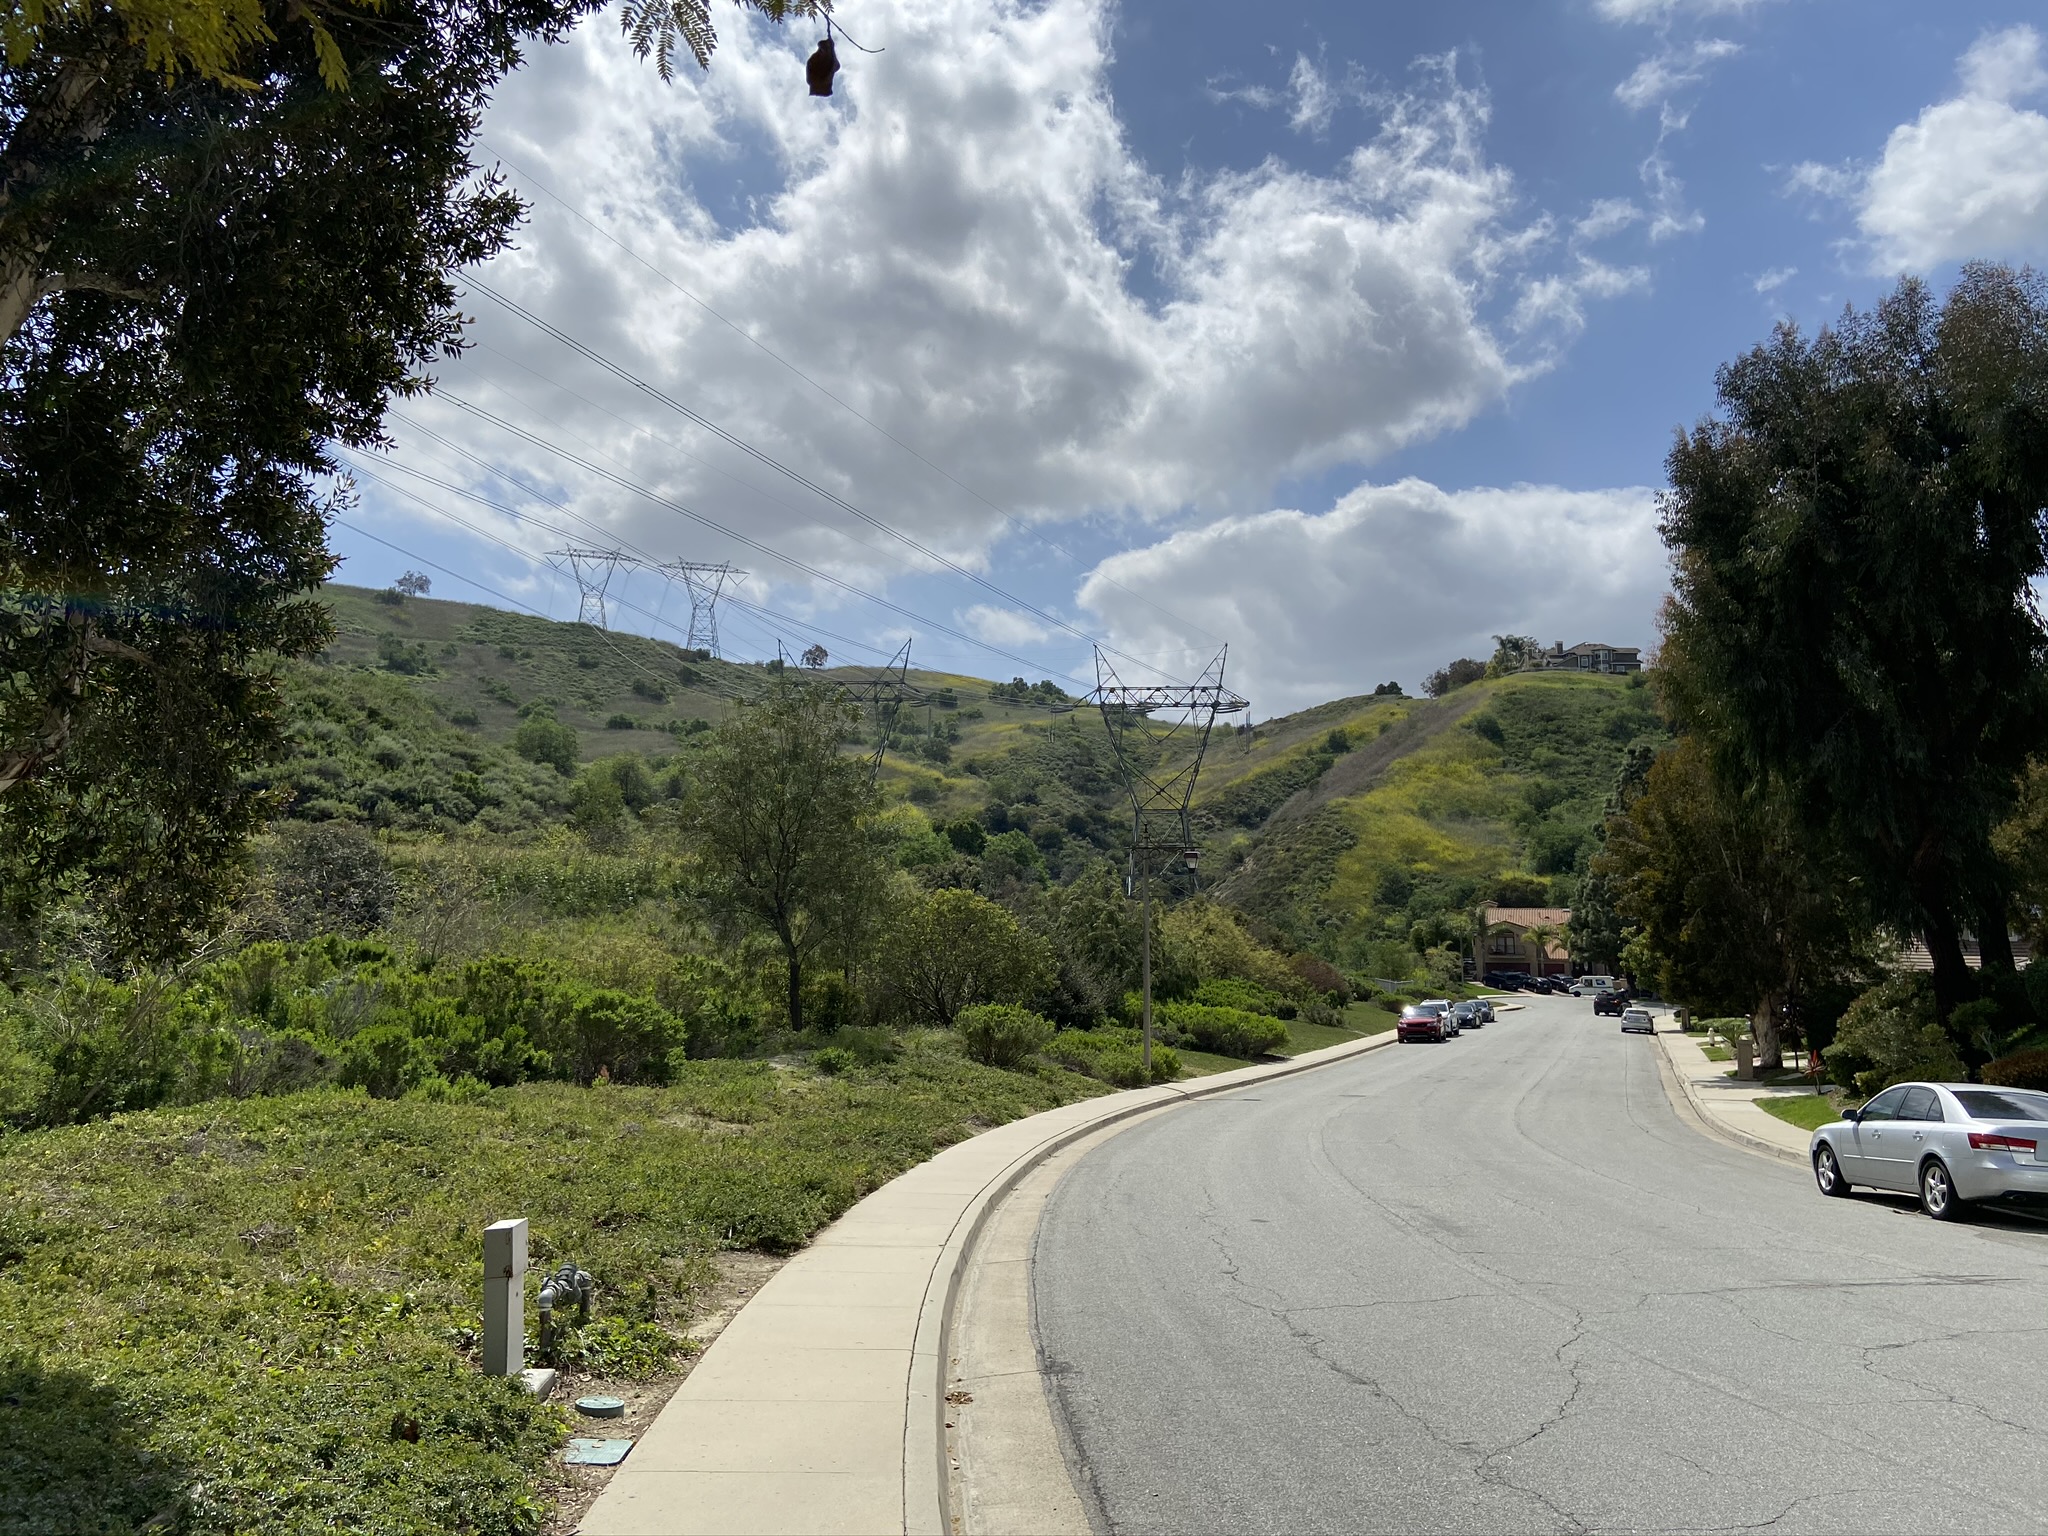
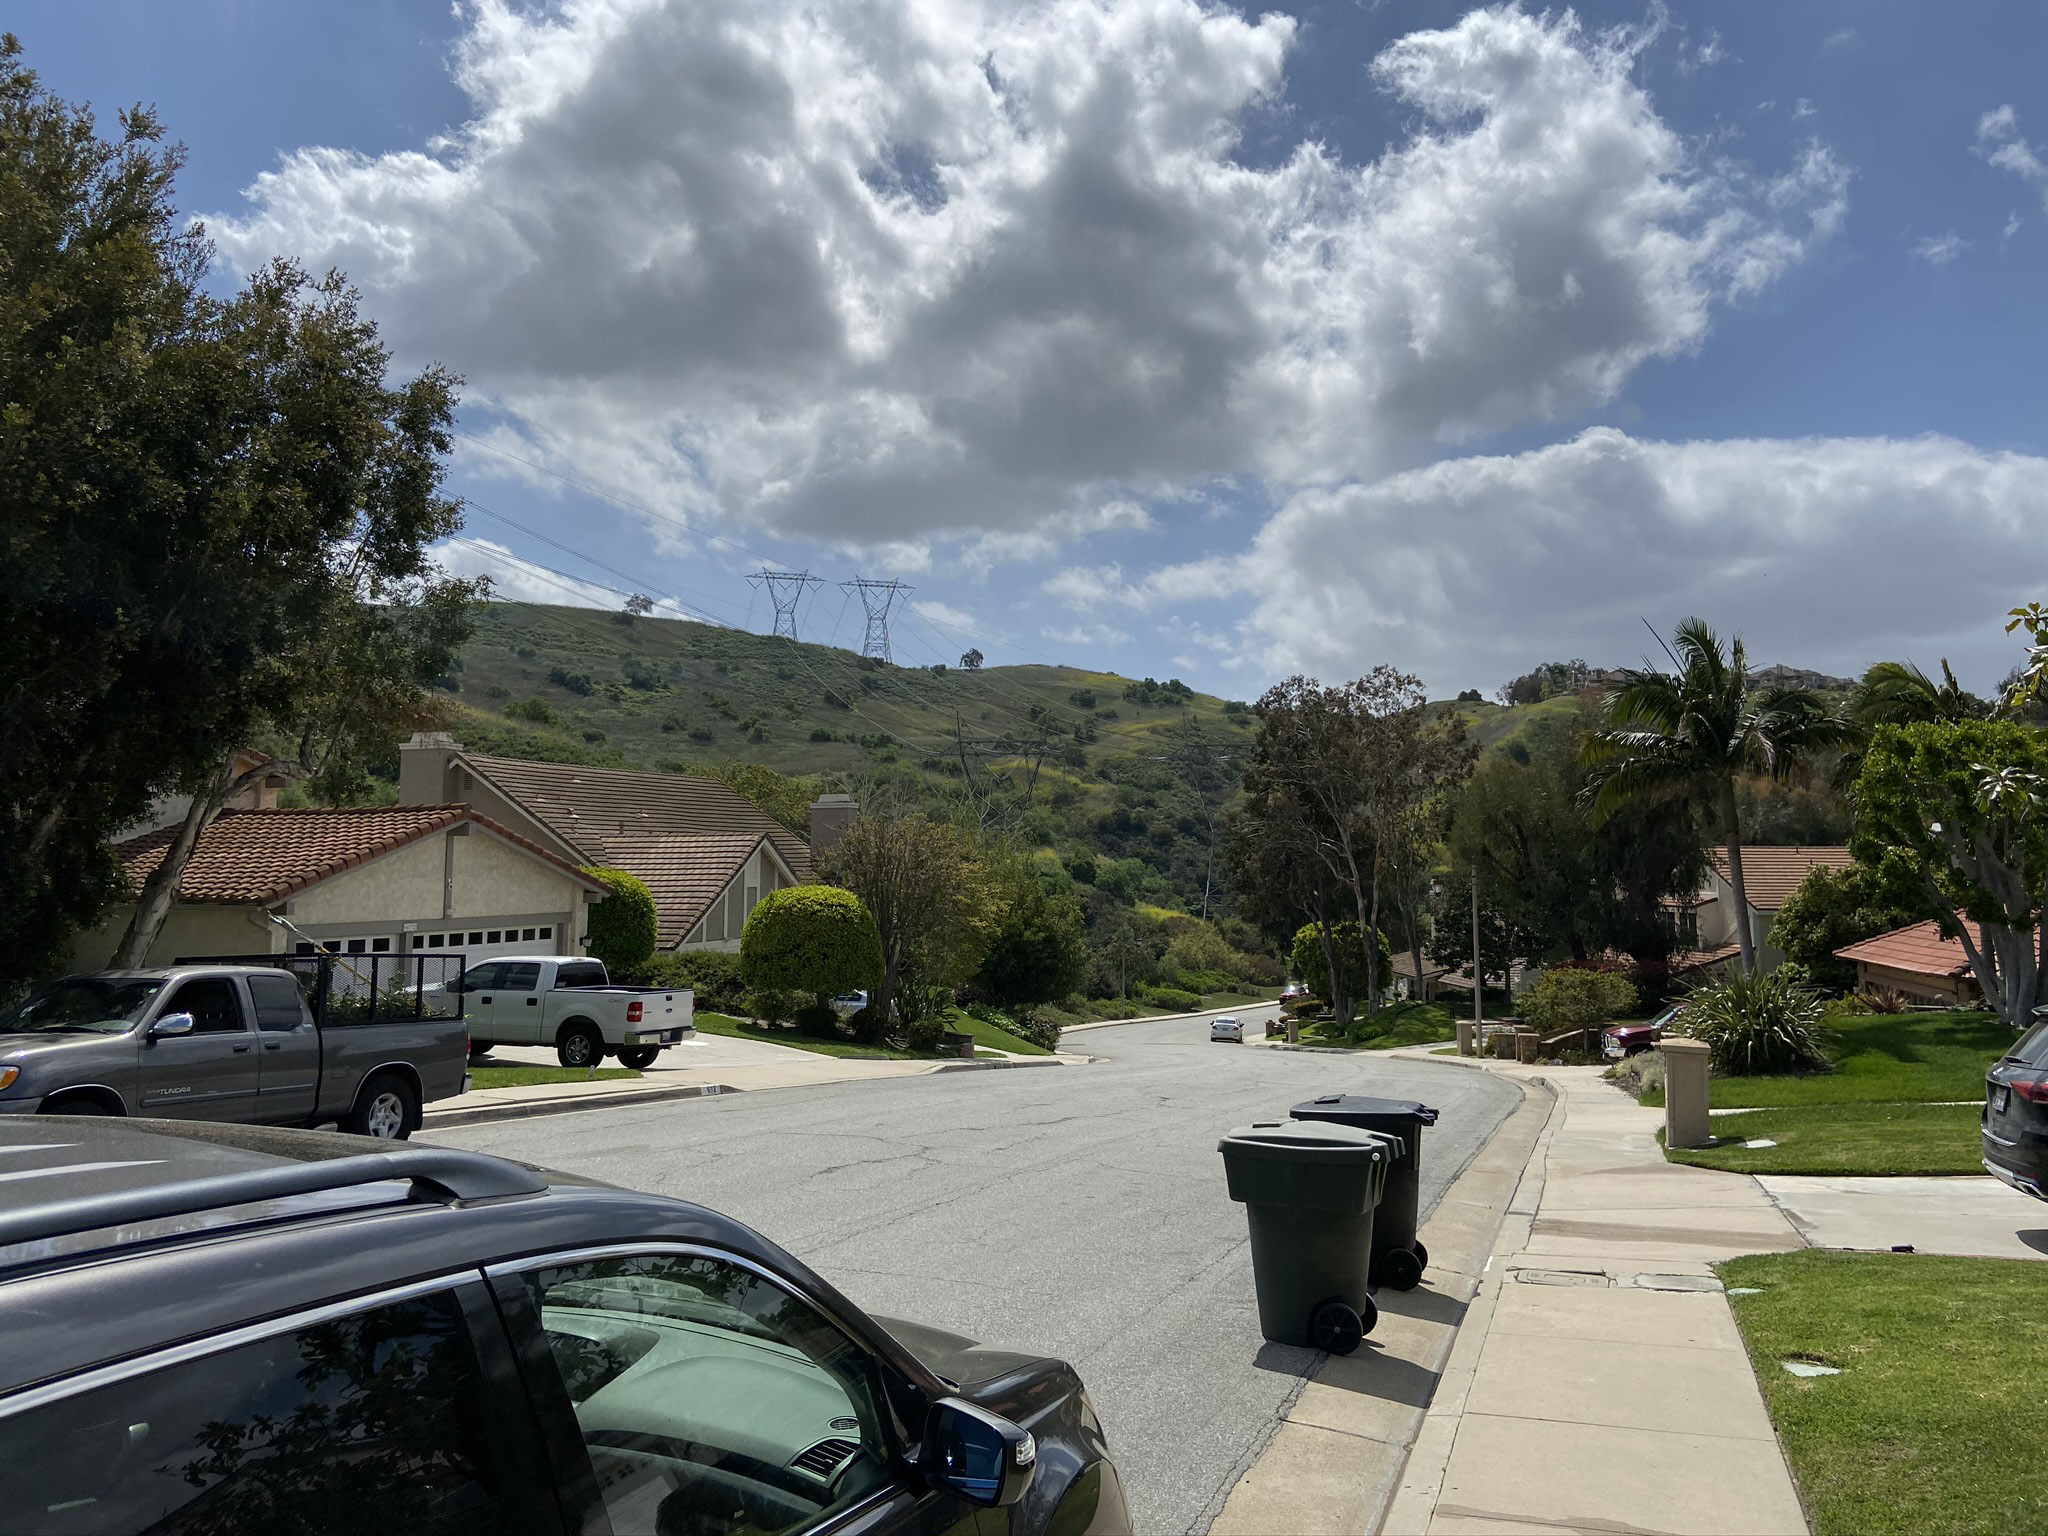
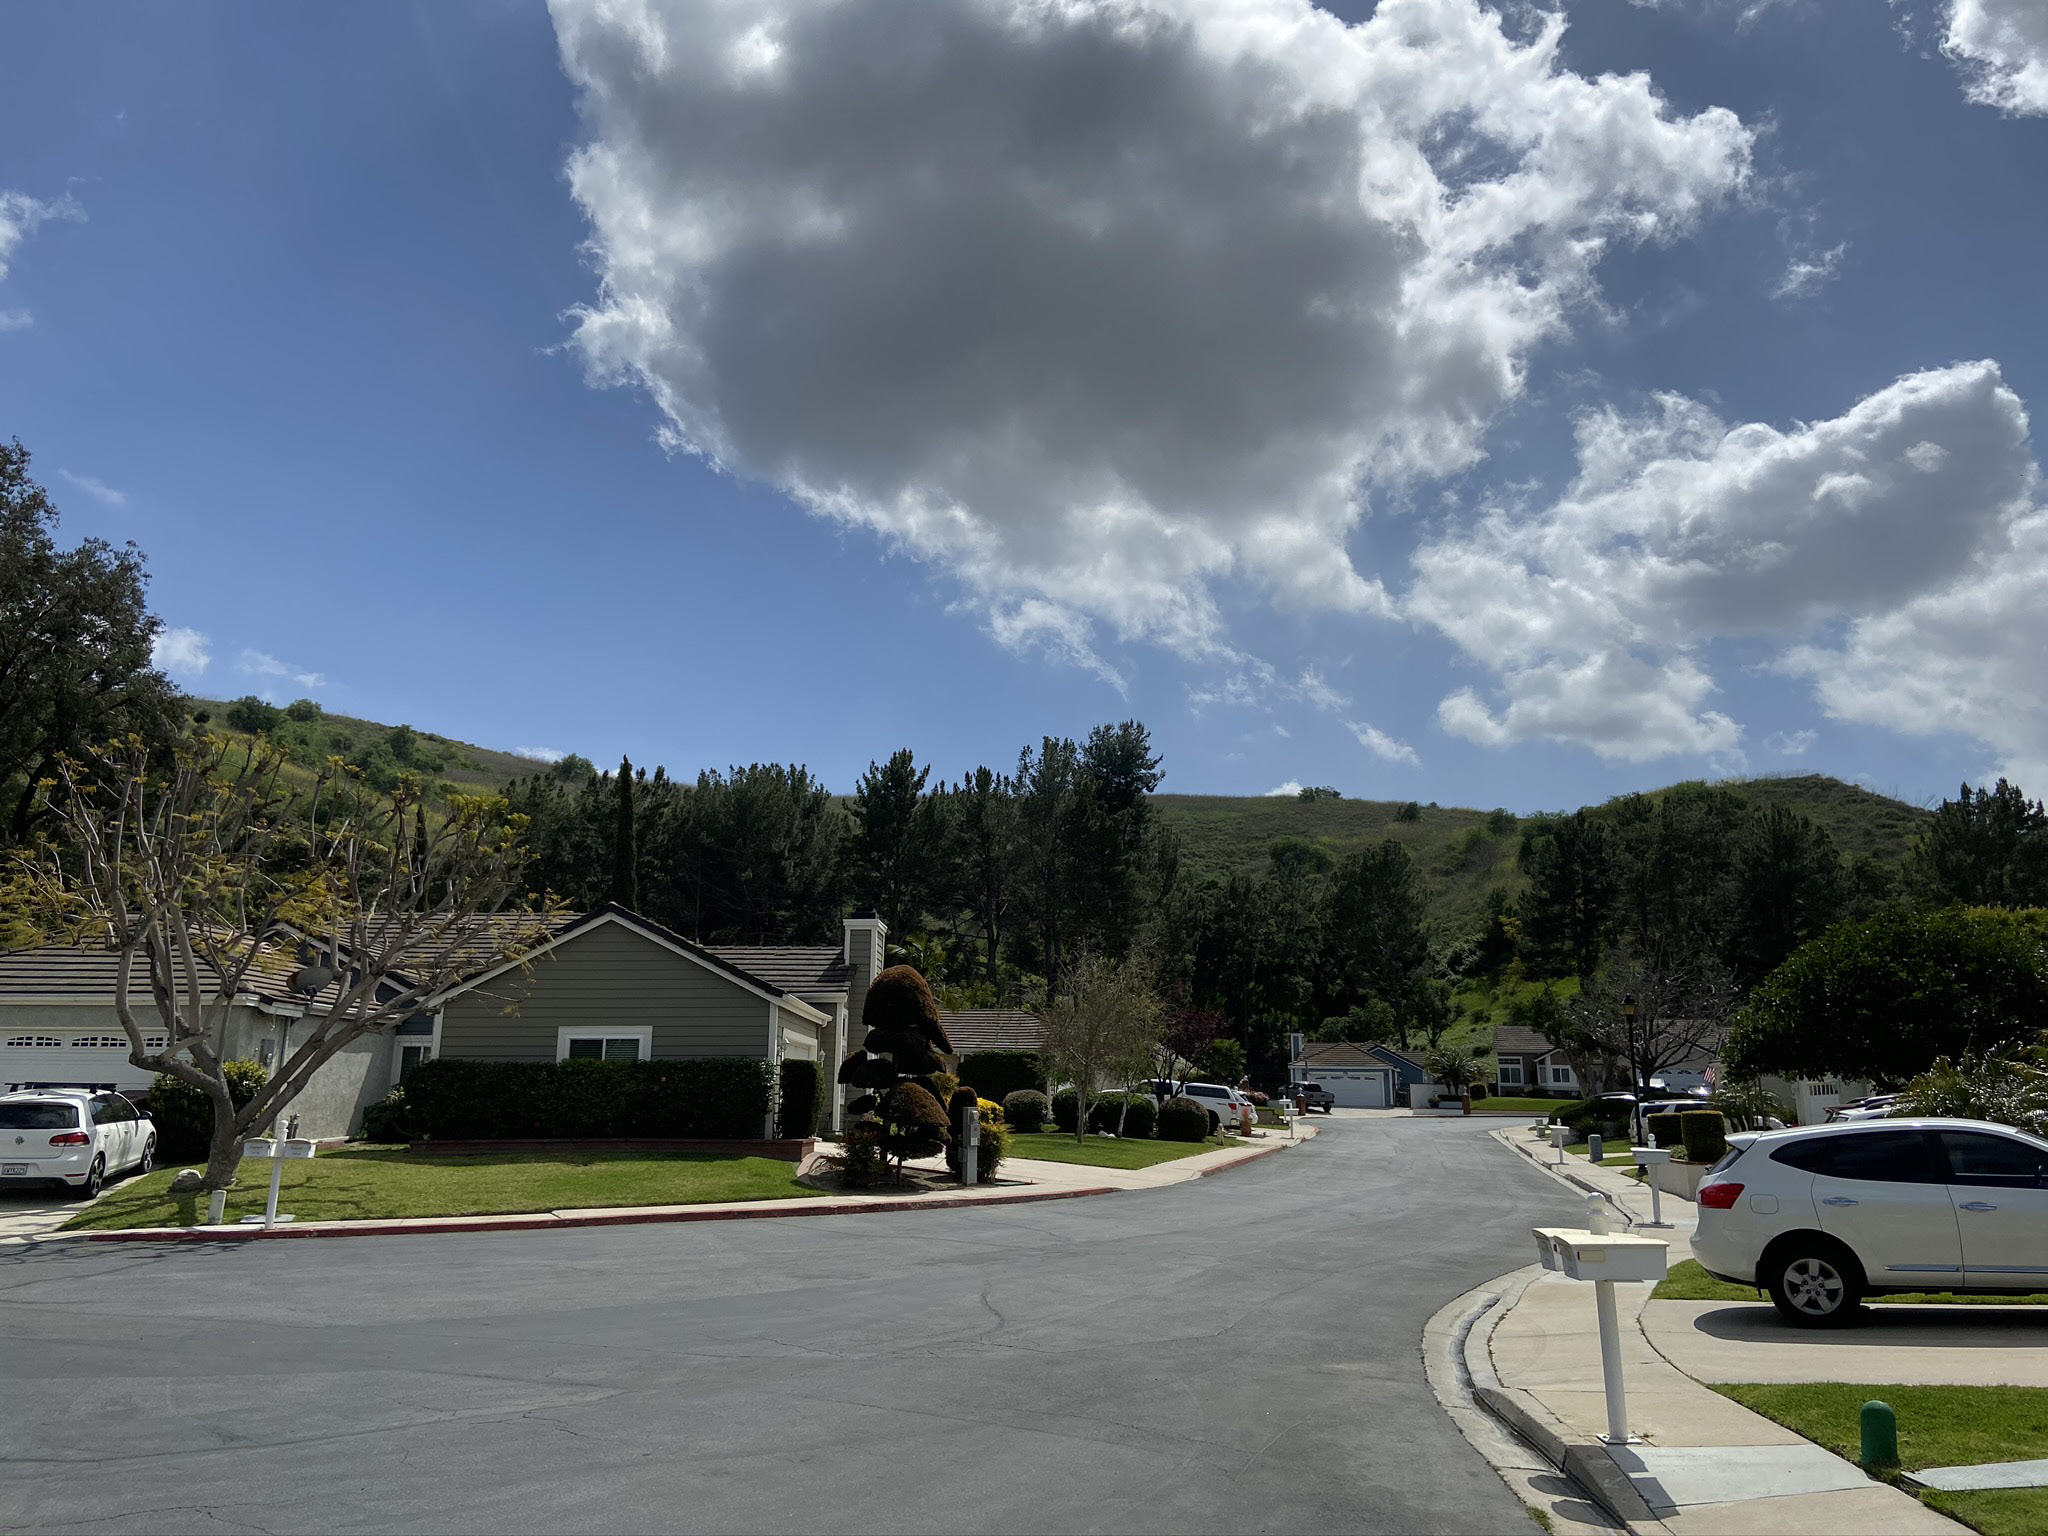
Step 2: Site Visit:
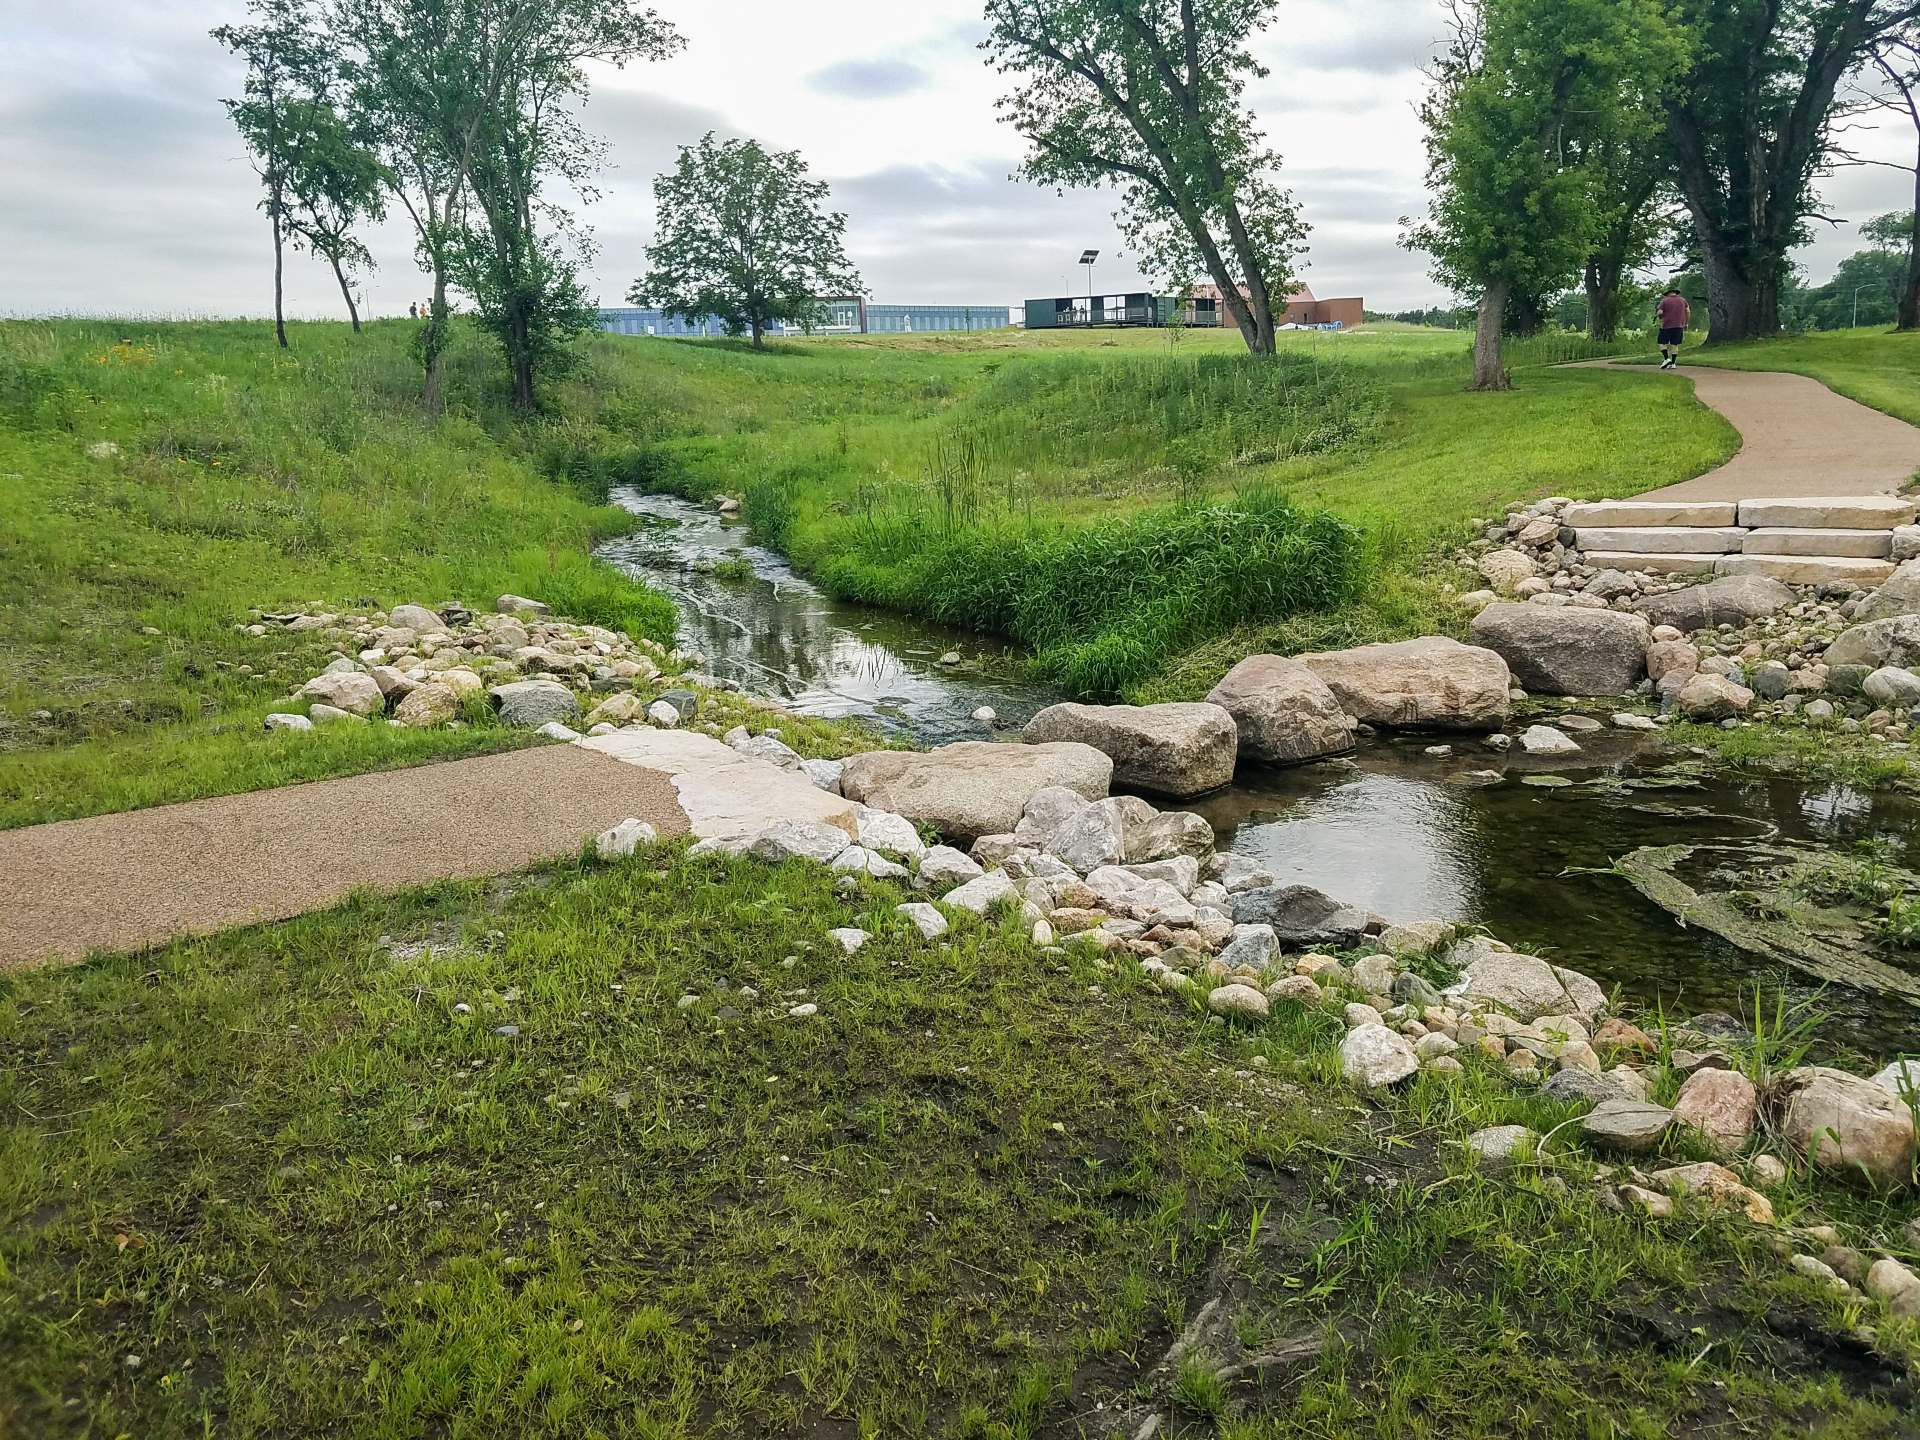
Great Ecology staff visited the site and surrounding communities within the 1 mile buffer to collect photos for rendering purposes. Although the GIS heatmap from step 1 showed a high-level of visibility for communities in the northern portion of the 3 mile buffer, the distance between the site and said communities made further action unnecessary. The visual impact of the site at a 2-3 mile distance would be near negligible due to the size of the solar installations and additional visual barriers, such as buildings and trees.
Step 3: Solar Tracker Modeling & Location Mapping
To create accurate visual renderings of the site, Great Ecology developed detailed and properly scaled 3D digital models of the developer's proposed dual-axis solar trackers. Utilizing CAD software, Great Ecology is able to create 3D digital models of numerous structures and systems including buildings, wind turbines, solar facilities, and more.
Great Ecology staff combined topographic data with the proposed site design to create an accurate model of the site layout and solar tracker positioning.
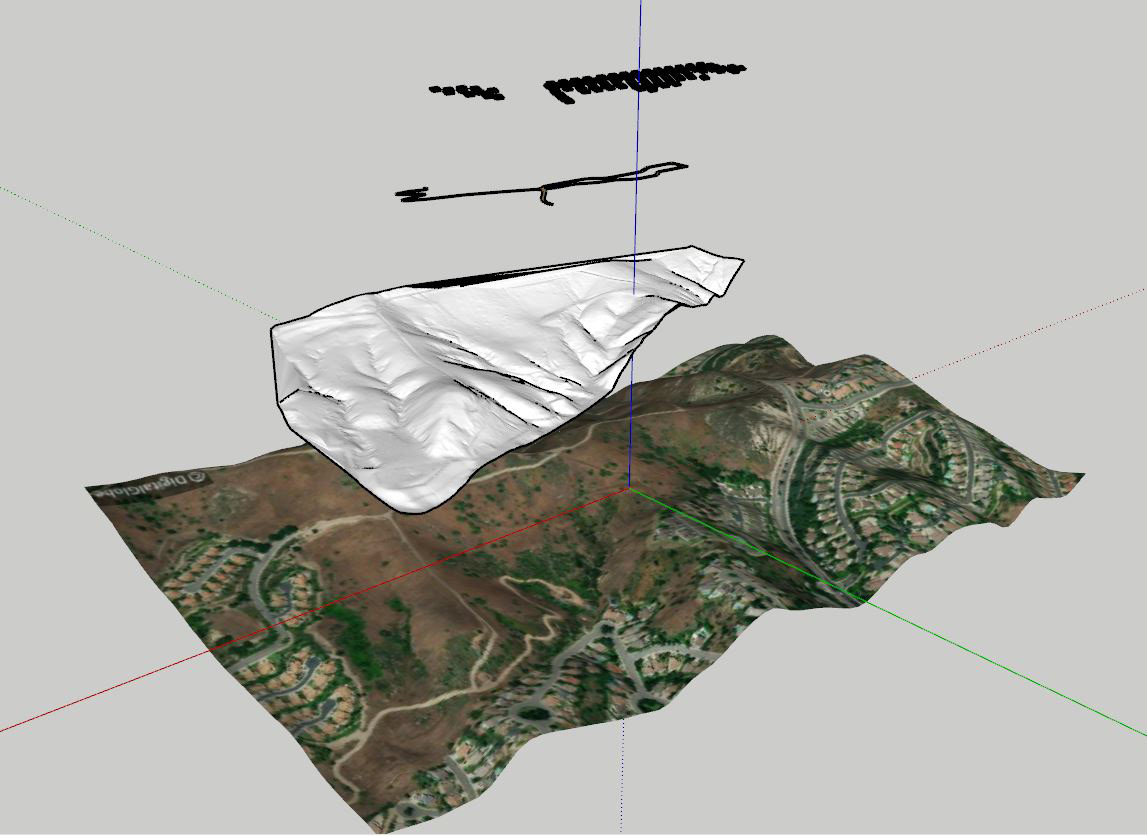
Step 4: Terrain Modeling & Combination
Utilizing GIS and CAD software, Great Ecology developed a detailed terrain model of the site and its access roads. By combining this model with that of the solar site and placing it over terrain imagery from Google Earth, Great Ecology produced an accurate 3D visual model of the site.
Final Aerial Rendering
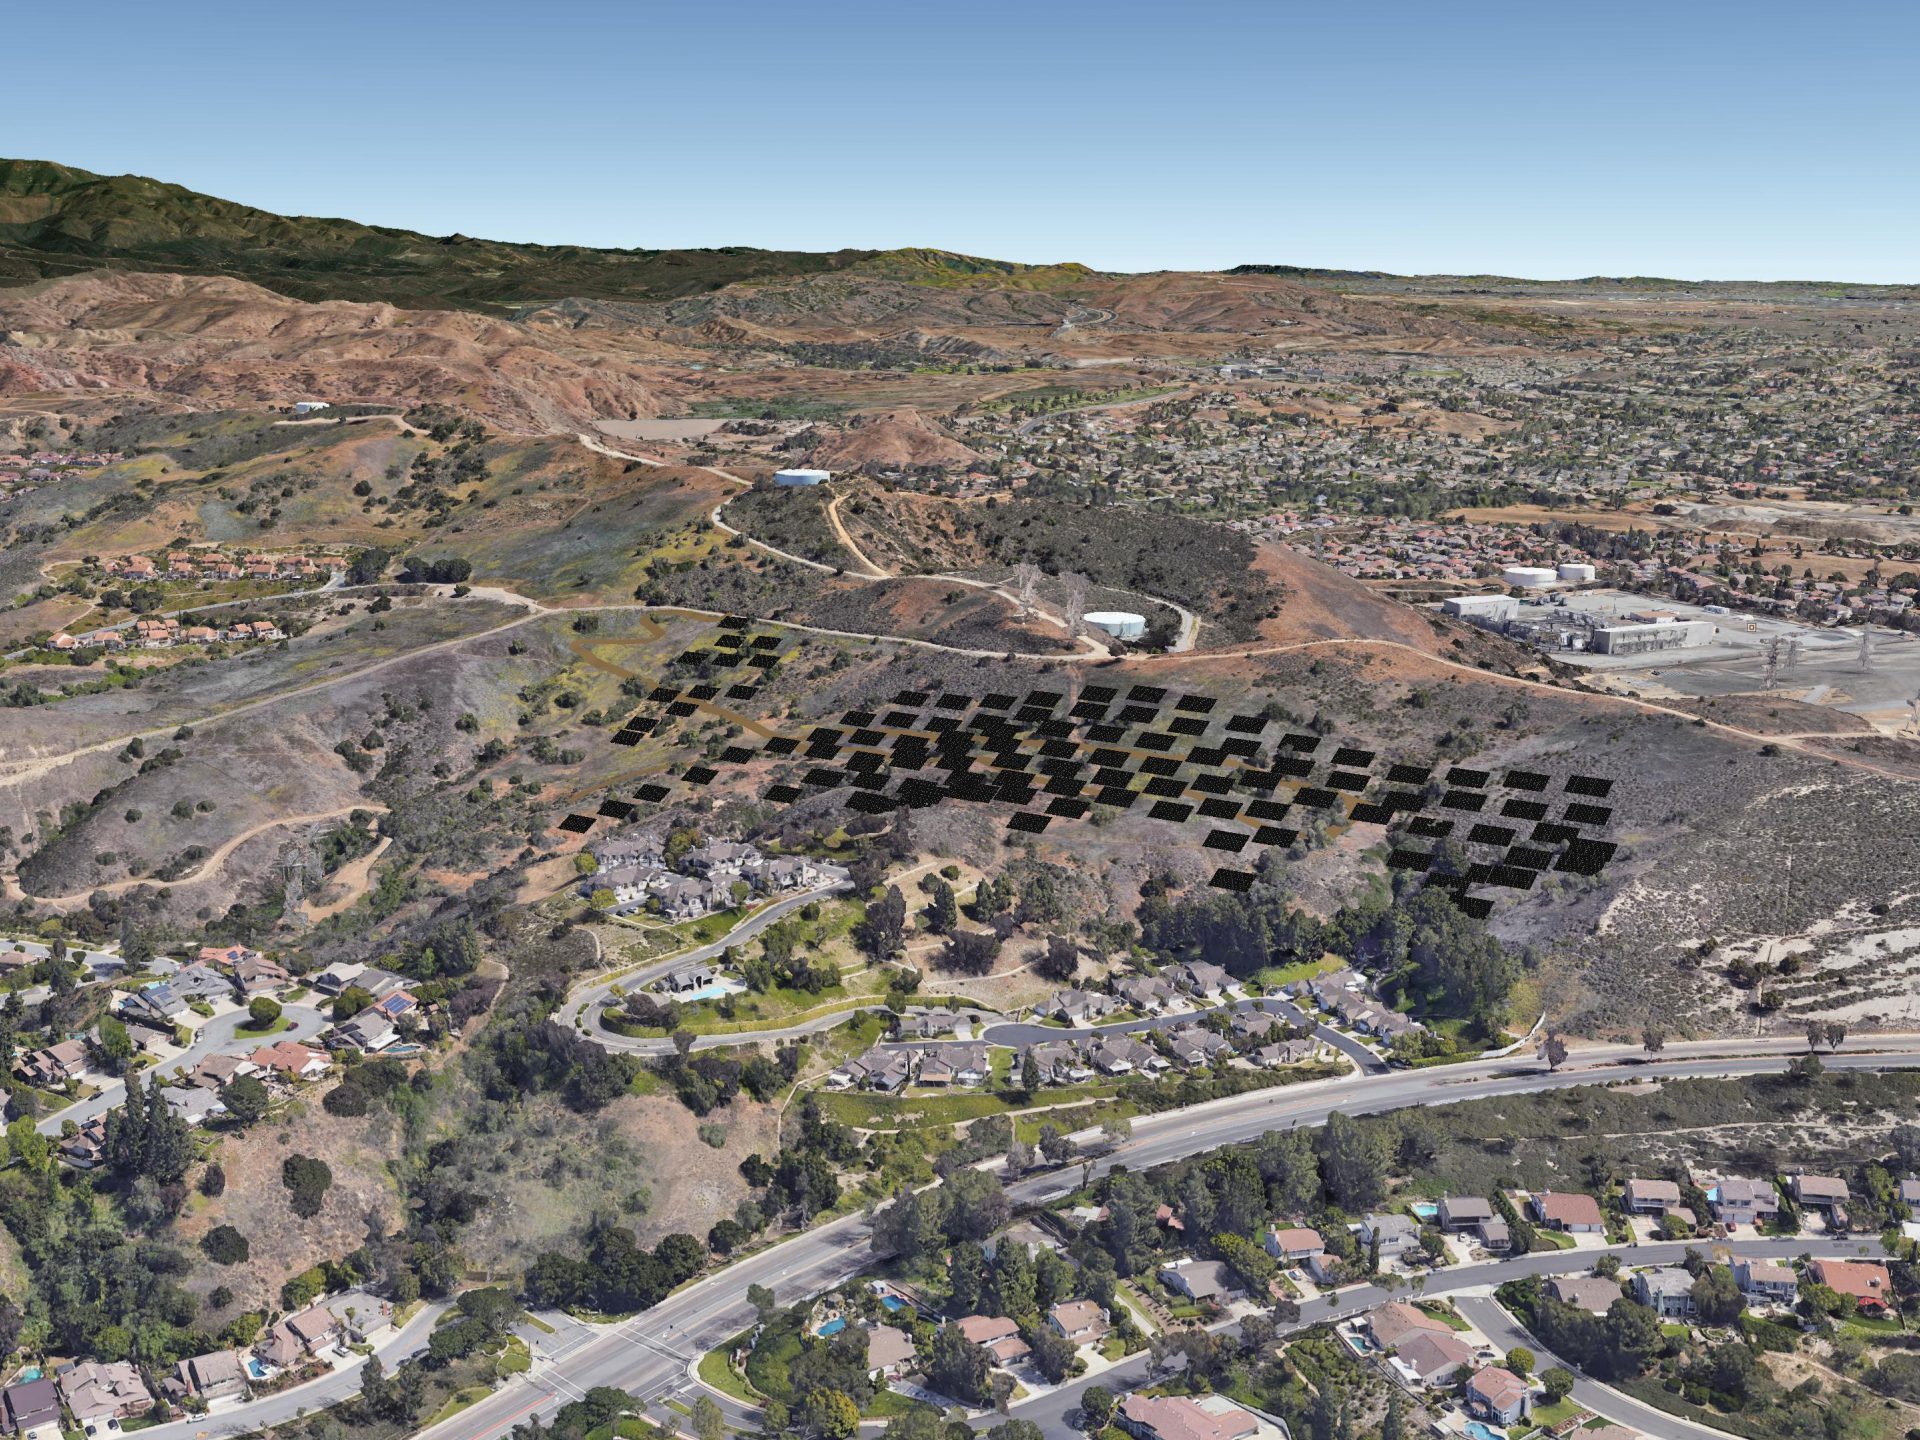
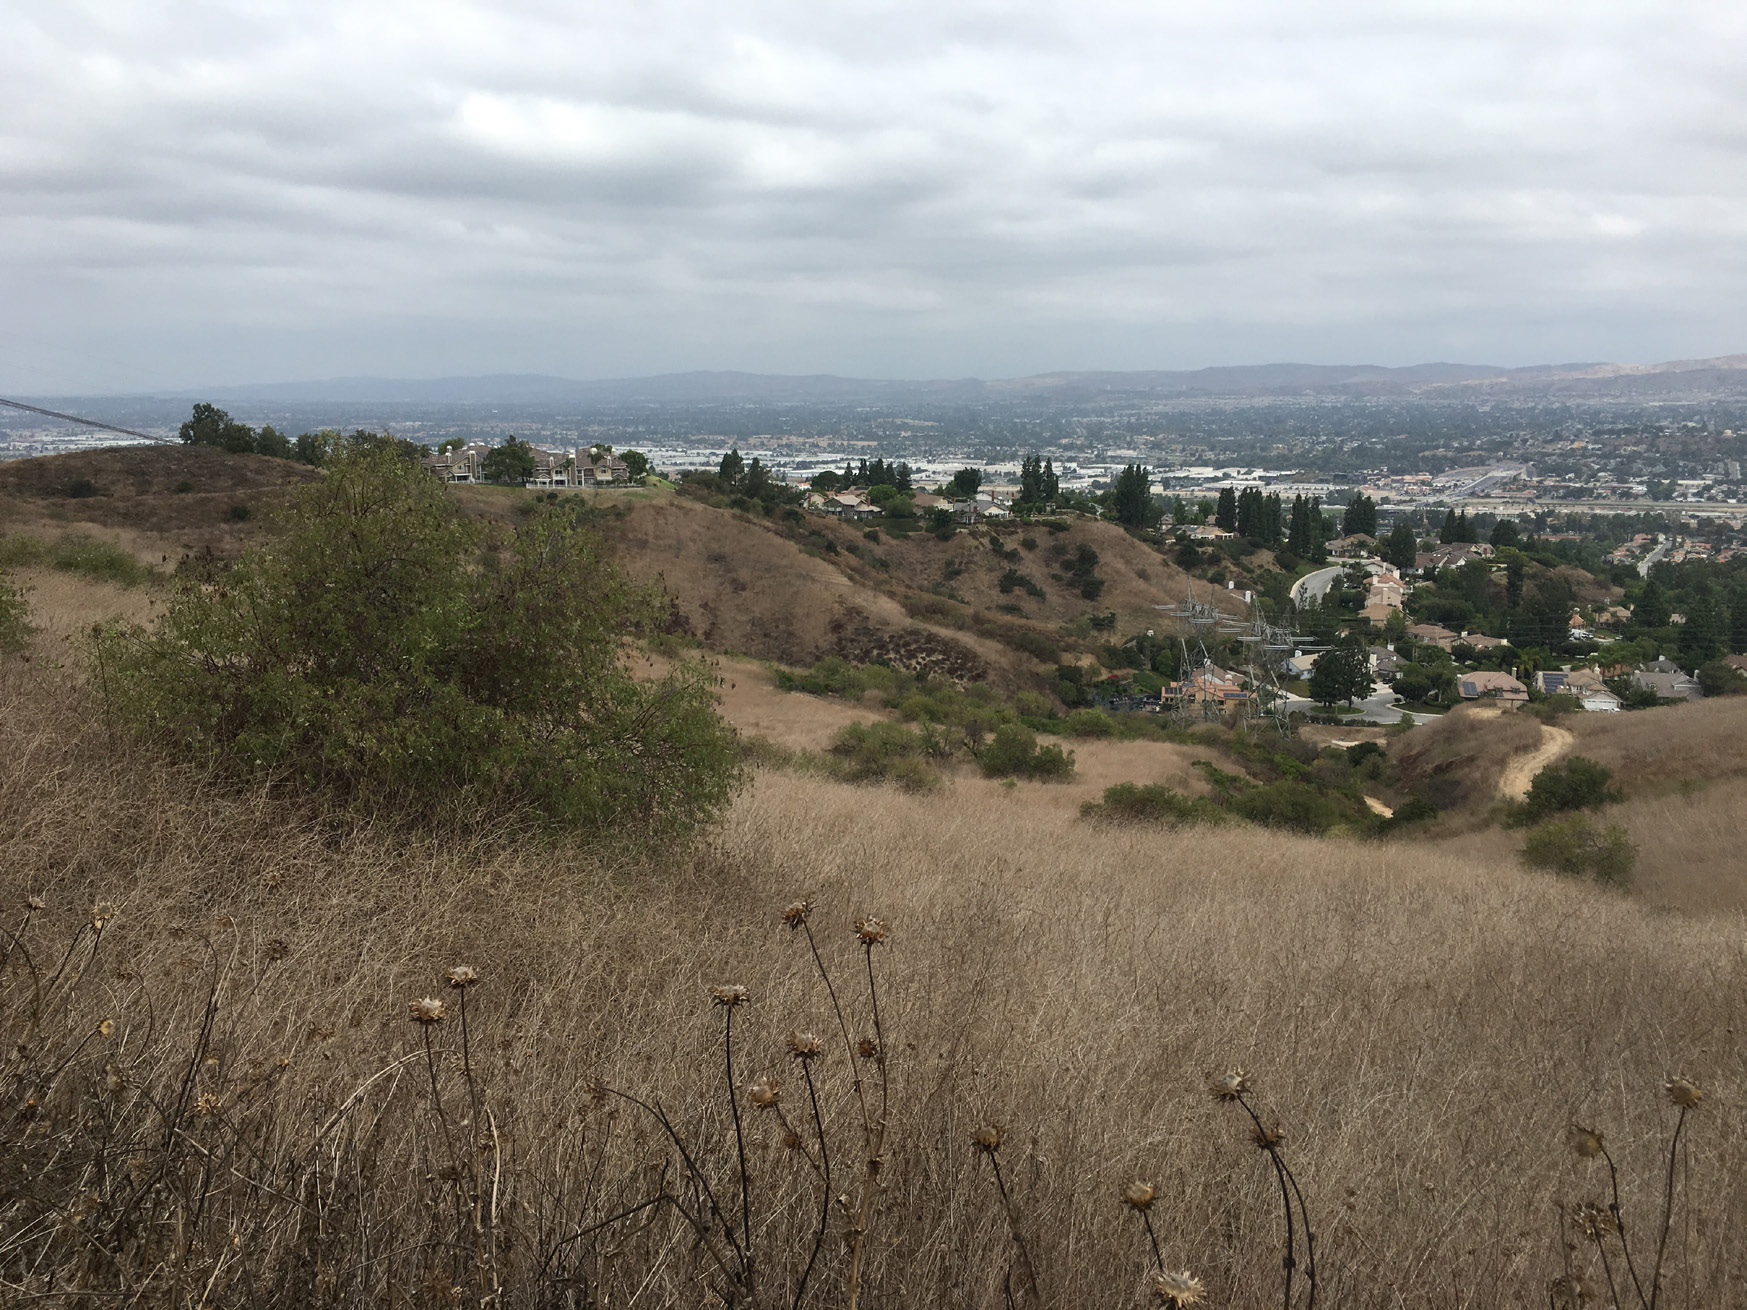
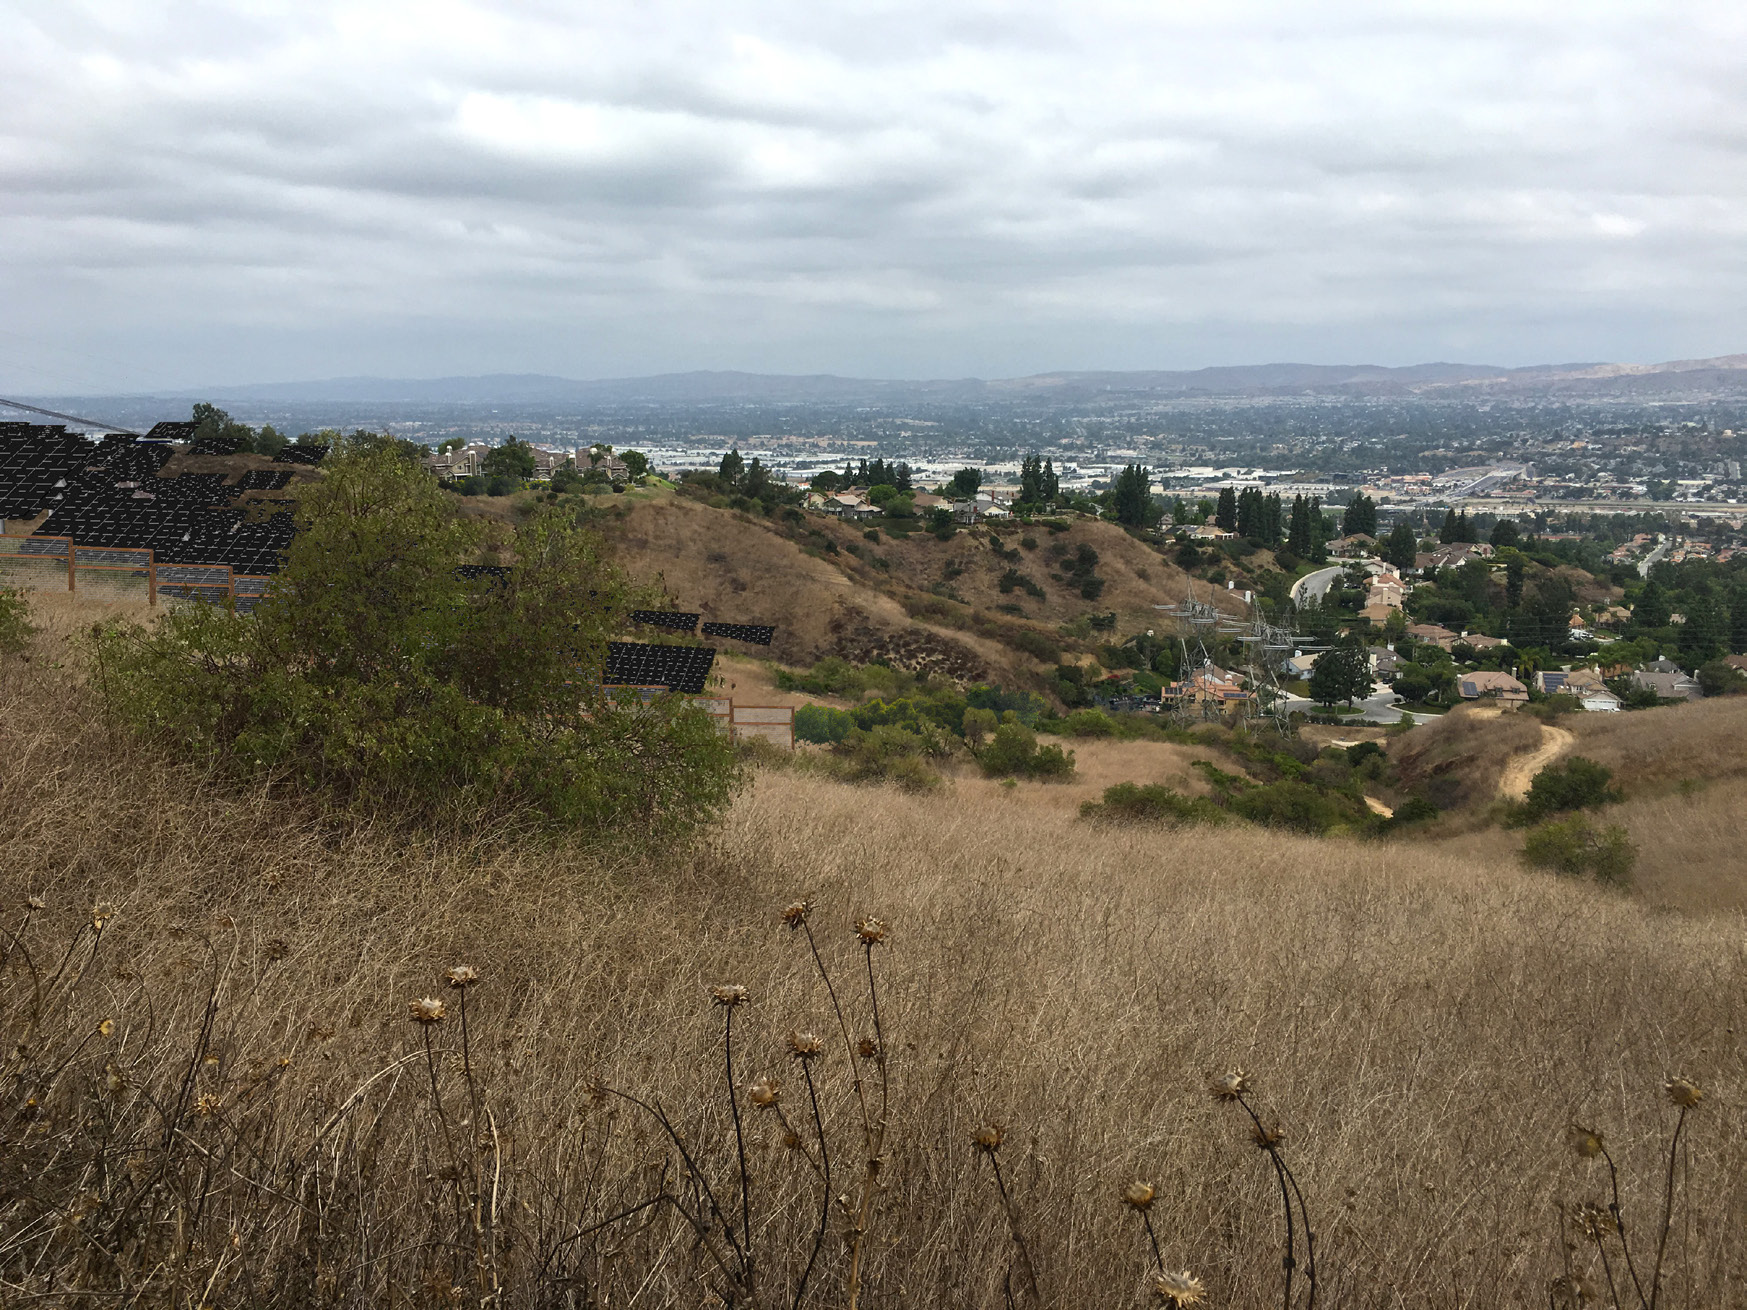
Perspective Renderings
Using the same models generated for the aerial site rendering, Great Ecology can create accurate view renderings from site photos. Not only are these great visual tools for use in community outreach, but they also help to inform site design and mitigation efforts. For this project, the viewshed analysis identified exact planting locations and concluded that these would result in the solar project having a minimal visual impact for a large percentage of the surrounding communities.